

What's New in OverShield 3.6

Predictive Monitor® is excited to announce the launch of OverShield® 3.6. This latest release greatly improves the user experience, making it faster than ever to navigate to the data you want to see and analyze/compare it in the OverShield Trend Chart.
The New OverShield Trend Chart
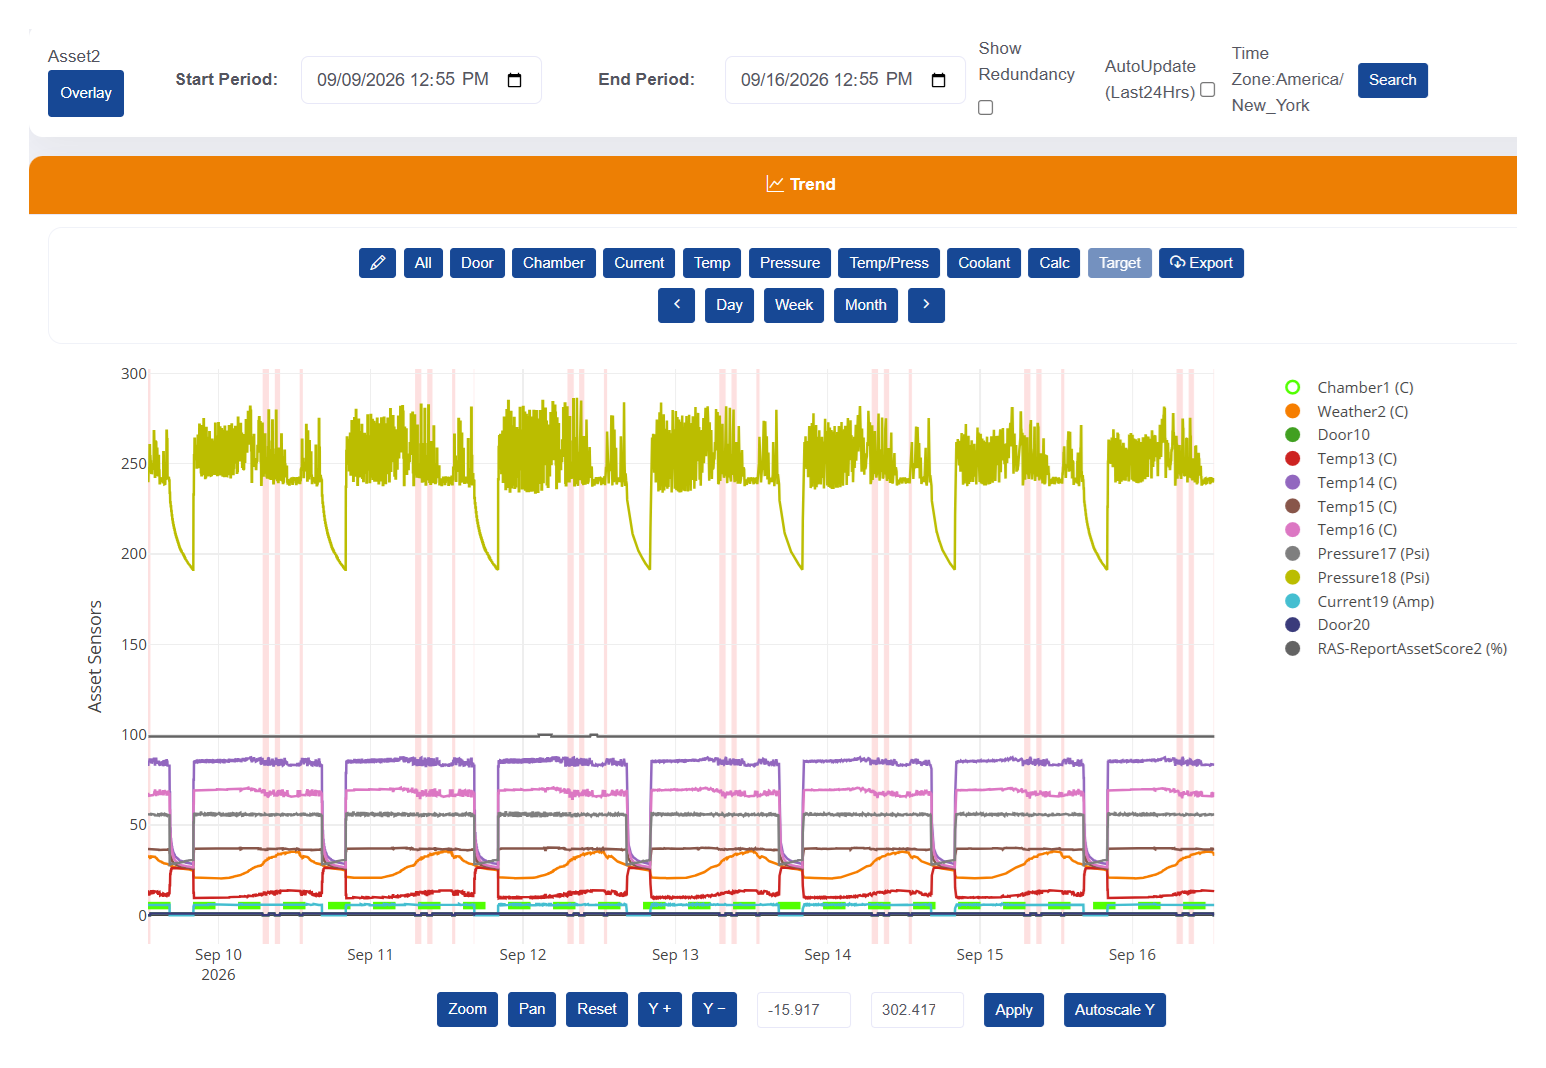
The OverShield Trend Chart is the visible representation of the sensor data being collected from a refrigerated asset. With OverShield 3.6, it just got easier to navigate and view the critical information needed for effective anomaly detection and troubleshooting.
Control Sensor Channels Directly from the Legend
In OverShield 3.6, selecting which sensor channels display on the Trend Chart is a whole lot easier because the sensor legend is also the sensor control center.
- To toggle a channel between visible and hidden, single-click on its sensor label.
- To hide all other channels except one, double-click on its sensor label.
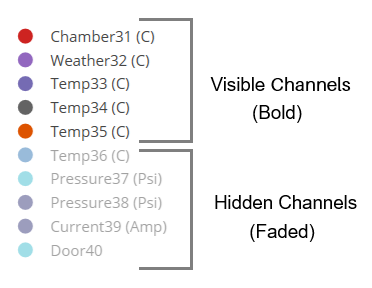
You can instantly tell whether a sensor's data is visible or hidden by how the labels appear in the legend:
- Bold colors represent sensors that are currently visible.
- Faded colors represent sensors that are currently hidden.
Improved Date Range Controls
In OverShield 3.6 you can easily advance the current Trend Chart range forward or backward by 1 day, 1 week, or 1 month with the click of a button.
Changing the date does not affect channel selections on the Trend Chart, which can now support up to 100 data channels and display up to 366 days of data.
Zoom, Pan, and Rescale in the Trend Chart
OverShield automatically scales the y-axis to fit the full range of sensor data, but this is now completely customizable in OverShield 3.6.

The Zoom feature lets you literally "zoom in" on any part of the Trend Chart simply by clicking and dragging on a specific area.
The panning feature lets you drag the Trend Chart up/down/left/right to view data that may have gone off the visible portion of the screen.
There are new buttons to incrementally expand/contract the y-axis, with the option to specify the exact numeric min/max values for this axis.
Compare Trend Charts
OverShield 3.6 provides the ability to display a full secondary Trend Chart underneath the original. This makes it possible to compare data from the same asset across two different time ranges, or compare performance data from two different assets.

Custom Sensor Buttons

Beyond the default set of sensor buttons in the Trend Chart, you can now create your own custom buttons and assign them to the sensors you want to view when the button is engaged.
Add Comments to Trend Data
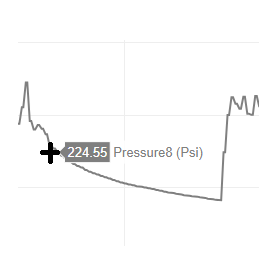
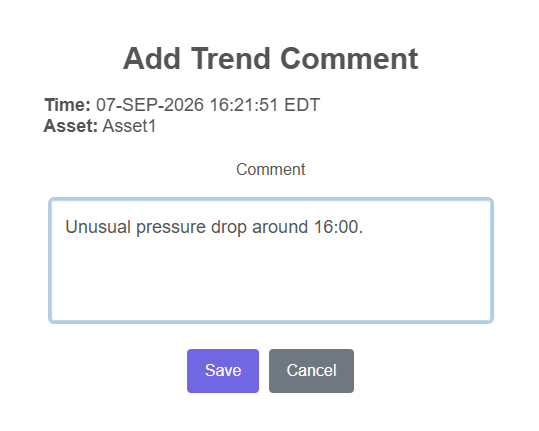
OverShield 3.6 gives you the convenience of making notes right inside the Trend Chart while examining data. Simply click on the trend line at the point where you want to comment and a comment box pops up, prefilled with the timestamp and asset name.
Improved Door Sensor Visibility
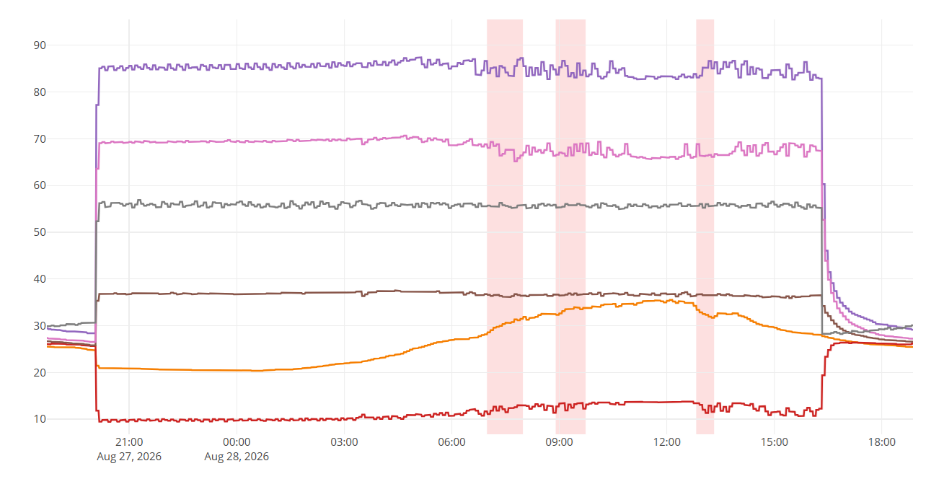
Door events (i.e., open/close) are challenging to see when looking at the data from multiple sensors. OverShield 3.6 shades this information in pink, making it extremely easy to see "door open" events and how that affects the other sensors.
Conclusion
There is a lot of powerful new functionality in OverShield 3.6, particularly in the Trend Chart. Make sure to refer to the Help link in OverShield to get the latest User Guide where all of these new features are explained in detail. Once you master these new tools and features, you will be able to navigate faster and analyze sensor data more thoroughly than ever before.
See OverShield in Action

Outcomes